Your PageSpeed Insights score changed, but nobody touched the site. If your PageSpeed Insights score jumped between late October and early November 2026, the cause may be the tool, not your pages.
PSI now runs Lighthouse 13.6.0, which changes how its Lantern simulation estimates FCP and LCP. Many sites, especially JavaScript-heavy ones, are seeing different lab scores with no code changes.
That matters if you report speed to clients, justify development spend, or prepared a WooCommerce store for Black Friday. A higher number can look like progress when it is really a change in the measuring scale.
This article explains what changed in Lighthouse 13.6, which sites are most affected, and how to check which version produced a result.
It also covers the difference between lab data and field data, and how the Performance score is calculated, so you can tell real improvement from a reporting artefact.
It is written for small business owners, WooCommerce store owners, marketers and in-house SEOs who use PSI to make decisions.
Key Takeaways
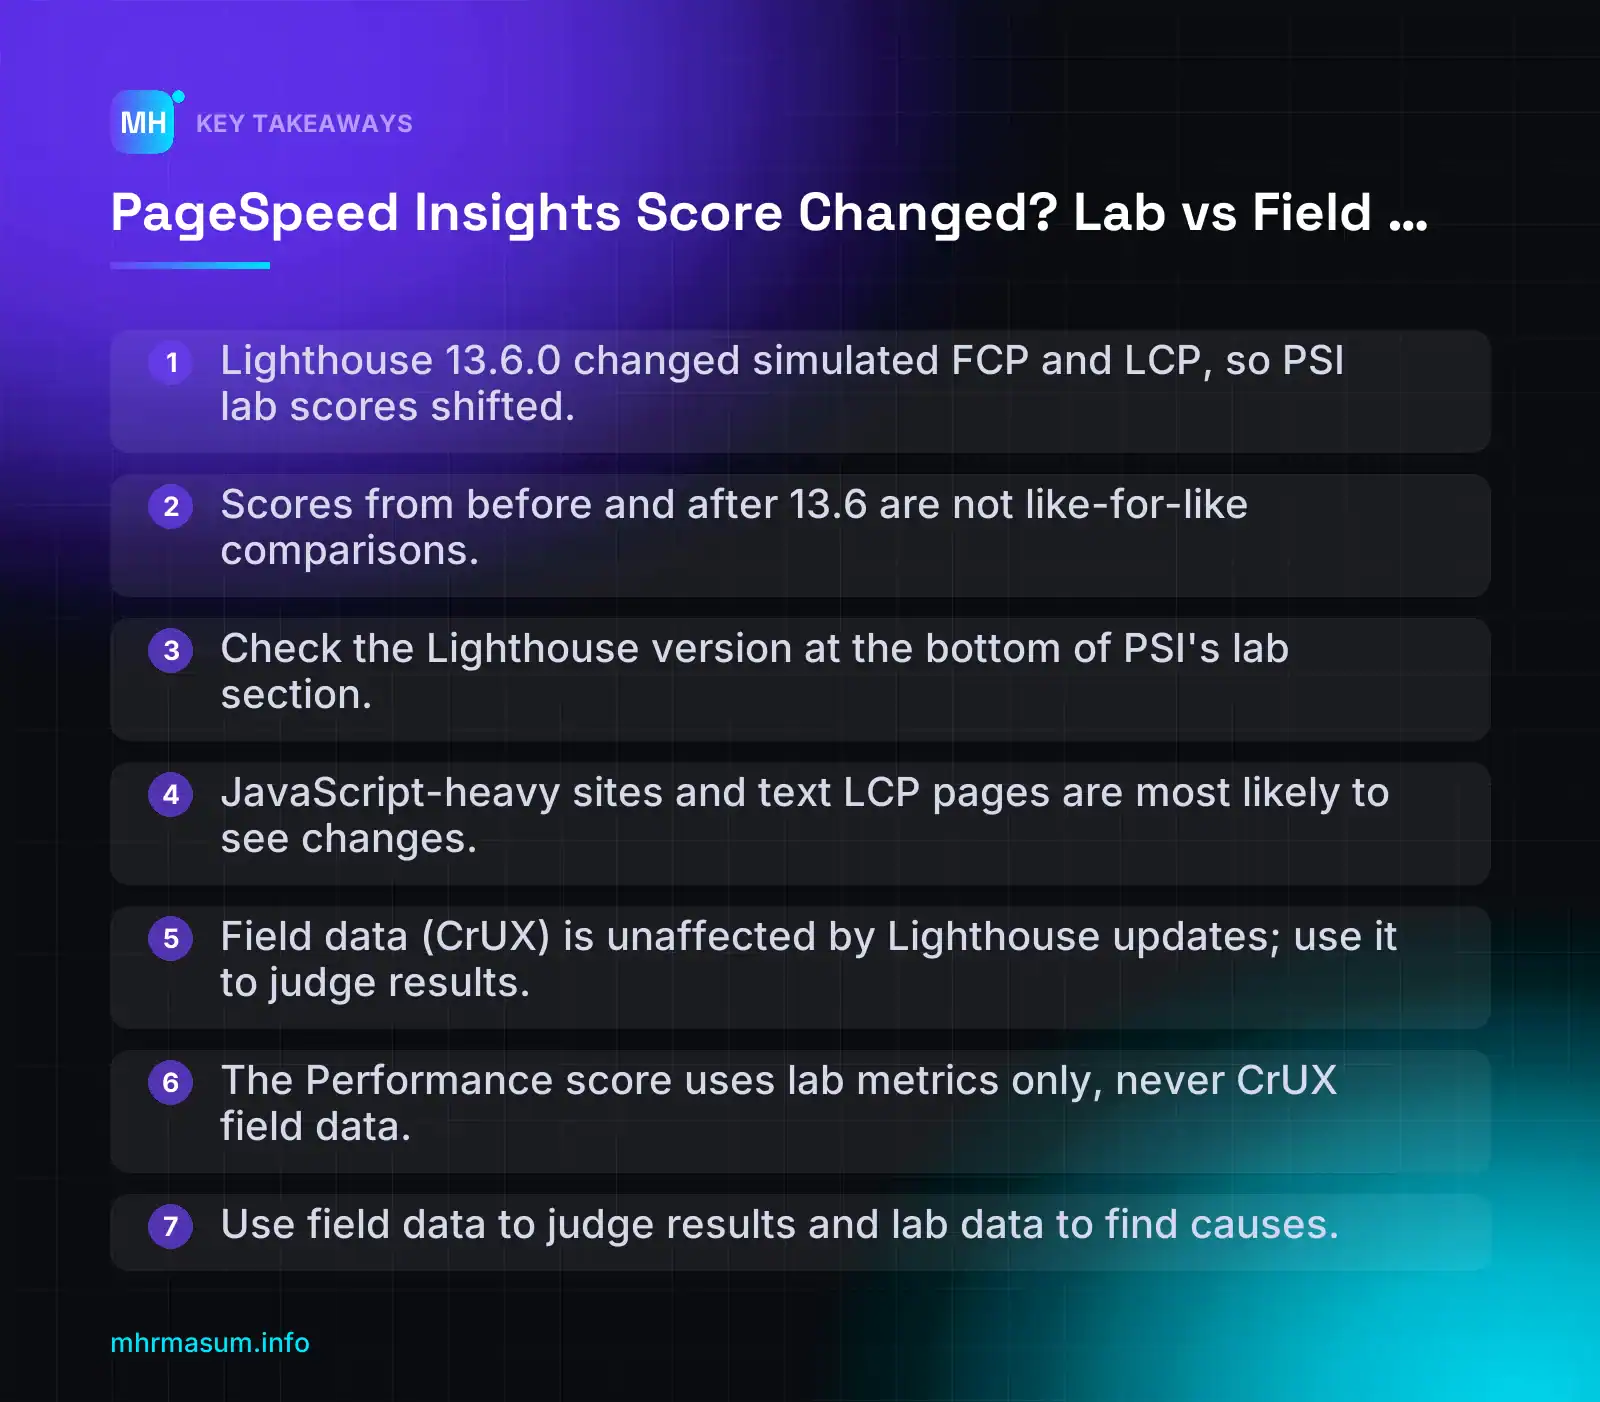
- Lighthouse 13.6.0 changed simulated FCP and LCP, so PSI lab scores shifted.
- Scores from before and after 13.6 are not like-for-like comparisons.
- Check the Lighthouse version at the bottom of PSI's lab section.
- JavaScript-heavy sites and text LCP pages are most likely to see changes.
- Field data (CrUX) is unaffected by Lighthouse updates; use it to judge results.
- The Performance score uses lab metrics only, never CrUX field data.
- Use field data to judge results and lab data to find causes.
Why your PageSpeed Insights score changed when nothing on the page did
PageSpeed Insights now runs Lighthouse 13.6.0. Its Lantern simulation estimates First Contentful Paint (FCP) and Largest Contentful Paint (LCP) differently from earlier versions, so your lab score can rise even if you have not changed a line of code.
Lighthouse 13.6.0 was released on 27 October 2026. The release notes said it would reach PSI within a week and ship in Chrome 159 DevTools (Lighthouse GitHub release).
Barry Pollard from the Chrome team has confirmed that 13.6.0 is live on PSI. He said it improves simulated FCP and LCP and gives more accurate and usually better scores (Barry Pollard on Bluesky).
If your score went up between late October and early November, check the tool version before you assume your site got faster.
What Lighthouse 13.6 changed
PSI lab data does not load your page on a slow connection. Lighthouse loads it on a fast connection and then uses Lantern to estimate how it would load on a slower network and CPU. When Lantern’s model changes, the estimate changes, even though your page has not.
The 13.6.0 release notes list these Lantern changes. Here they are in plain English:
- HTTP/3 is treated as multiplexed. Many requests can share one connection, as they can over HTTP/2. The model no longer treats HTTP/3 requests as if they queue up the old way.
- HTTP/2 overflow bytes are credited. Data sent over an HTTP/2 connection is accounted for more accurately in the simulated timings.
- Connectionless requests are excluded from connection counts. Requests that never open a network connection, such as those served from memory or a data URL, no longer inflate the connection model.
- Origin round-trip time (RTT) and throughput are estimated better. The simulation makes better guesses about how far away each server is and how fast it delivers data.
- Redirects are handled better. Redirect chains are modelled more accurately in the simulated load.
- Trace engine upgrades. The code that reads the browser trace has been updated.
Two further changes are described by Search Engine Journal (Search Engine Journal):
- How render-blocking is decided. Lighthouse 13.5 used each request’s fetch priority to decide whether that request blocked rendering. 13.6 revises this logic. The public notes do not give the full algorithm. If you need the detail, read the linked pull requests on the GitHub release.
- Text LCP painted in the same frame as FCP. When the LCP element is text and it paints in the same frame as FCP, Lantern now estimates LCP from the same requests and tasks it uses for FCP. Before this change, the two metrics could be estimated from different sets of work.
The preloaded JS modules example
SEJ reports one clear case that shows why the old simulation could mislead. In earlier versions, preloading JavaScript modules could make simulated LCP worse, even though the real page loaded faster for users.
Consider a developer who added this to speed up a page:
<link rel="modulepreload" href="/assets/app.js">
<link rel="modulepreload" href="/assets/vendor.js">
Real users got a faster page. Lighthouse 13.5 could still report a worse lab LCP. This was a flaw in the model, not in the page. Under 13.6, that page may suddenly score better, which is the simulation catching up with reality.
Which sites are most likely to see a jump
Pollard said the change is not specific to single-page apps, but it is more likely to affect JavaScript-heavy sites. In practice, look closely if your site has:
- A React, Vue, Next.js or similar front end, or a headless WooCommerce build.
- A WordPress theme or page builder that loads many scripts before content appears.
- Preloaded or module-based JavaScript.
- A text heading or paragraph as the LCP element (common on blog posts and service pages).
- Hosting or a CDN that serves over HTTP/3.
A simple WordPress brochure site with little JavaScript may see a small change or none. That is normal too.
The key point: before and after are not like-for-like
Scores from before and after 13.6 were not measured with the same simulation. Comparing them is like weighing a parcel on two different scales and calling the difference weight loss.
This matters most in November. If you made speed tweaks ahead of a sale (see Black Friday SEO for WooCommerce), do not credit that work with a higher PSI score until you have checked the Lighthouse version and the field data.
To check which version produced a result, scroll to the bottom of the lab section in PSI, where the run details show the Lighthouse version. If you use the API, read this field:
{
  "lighthouseResult": {
    "lighthouseVersion": "13.6.0"
  }
}
Also note that Chrome 159 stable is due in December. Until then, DevTools in your current Chrome may run an older Lighthouse than PSI. A DevTools run and a PSI run can disagree for that reason alone.
The official PSI release notes page says the API stays at v5 while the Lighthouse version changes independently (PSI release notes). That page may not list 13.6 yet, so check it alongside the GitHub release.
This is not the first time this has happened. In Lighthouse 12.2.3, the CPU throttling factor was adjusted for PSI only. Total Blocking Time improved for every site on PSI, while CLI and DevTools results did not change (Lighthouse 12.2.3 release). Tool-driven score shifts are a recurring event, so your reporting should allow for them.
Lab data vs field data: two different measurements on one report
A PSI report shows two separate measurements on one page. The top section is field data from real users. The lower section is lab data from a single Lighthouse run. They answer different questions, and only one of them is affected by a Lighthouse update.
Google’s own documentation explains both data sources (About PageSpeed Insights).
| Lab data (Lighthouse) | Field data (CrUX) | |
|---|---|---|
| Source | Lighthouse run from Google’s servers | Chrome User Experience Report (CrUX) |
| Who and what is measured | One simulated page load on an emulated device, with simulated throttling | Real Chrome users visiting the URL or origin |
| Time window | The moment you click Analyse | A trailing 28-day period |
| Metrics shown | Performance score, FCP, LCP, TBT, CLS, Speed Index | LCP, INP, CLS (Core Web Vitals), plus FCP and TTFB, at the 75th percentile |
| What it is used for | Diagnosing problems and testing fixes | Understanding real user experience; the Core Web Vitals assessment |
| Changes when Lighthouse updates? | Yes, it can shift with no site change | No, it is not affected by Lighthouse versions |
Lab data (Lighthouse)
Lab data is one page load, run on demand. PSI always uses simulated throttling. Lighthouse loads the page on a fast connection, then estimates how it would perform on a slower network and CPU (DebugBear on simulated throttling).
That is why lab data is good for diagnosis:
- You get results immediately, without waiting for 28 days of user data.
- You see specific insights, such as render-blocking resources and large images.
- You can test a staging change or a new page that has no traffic yet.
Its weakness is equally clear. Because the result is an estimate, it can change when the estimating model changes, which is exactly what happened with 13.6. It also varies from run to run because of network and server conditions.
If you want to see what Lighthouse actually observed rather than simulated, download the full Lighthouse JSON. It contains observed timings as well as the simulated ones.
Field data (CrUX)
Field data shows how real Chrome users experienced your page over the last 28 days. Each metric is reported at the 75th percentile, so the value shown is the experience that 75% of visits met or beat.
Key points to understand:
- It moves slowly. A fix you shipped yesterday affects only a small share of a 28-day window, so expect a gradual change over several weeks.
- It may fall back to the origin. If a URL lacks enough data, PSI shows origin-level data for the whole site instead, or no field data at all. Check which one you are looking at.
- It is not affected by Lighthouse versions. A Lighthouse update cannot move your CrUX numbers. Only changes in real user experience can.
- The Core Web Vitals assessment is field data. The “passed” or “failed” result at the top of PSI comes from CrUX, not from the Performance score.
Most importantly, CrUX does not feed into the Lighthouse Performance score. The 0–100 number is calculated only from lab metrics.
“My PSI score went up, so Google sees my site as faster.”
Not quite. The Performance score is a lab estimate from one simulated load. After 13.6, it may have risen because the simulation changed, not because users got a faster page.
The data that reflects real user experience is CrUX field data, which you can see in PSI’s field section and in the Core Web Vitals report in Search Console. If those numbers have not moved, real users have not noticed any change.
A practical rule for reports: use field data to judge results and lab data to find causes. This is the same principle I recommend for ranking reports, where you check Search Console before trusting a third-party tool (see Rank Tracking Accuracy: A Search Console-First SEO Report).
If you are unsure whether your speed problems are real or a reporting artefact, start with a free SEO check and compare it against your field data before spending development time on fixes.
How the Performance score is calculated (and why small metric shifts move it)
The Performance score is a weighted average of five lab metrics, each converted into its own 0–100 score first. Once you know how that conversion works, a sudden jump after a Lighthouse update makes sense.
The score comes only from the lab (Lighthouse) run. CrUX field data plays no part in the Performance score, even though both appear in the same PSI report (PageSpeed Insights documentation).
Metric weights
Since Lighthouse 10, the weights look like this (Chrome for Developers: Lighthouse performance scoring):
| Metric | Weight | What it measures |
|---|---|---|
| Total Blocking Time (TBT) | 30% | How long the main thread is blocked by long tasks between FCP and full interactivity |
| Largest Contentful Paint (LCP) | 25% | When the largest image or text block in the viewport is painted |
| Cumulative Layout Shift (CLS) | 25% | How much visible content moves unexpectedly |
| First Contentful Paint (FCP) | 10% | When the first text or image is painted |
| Speed Index (SI) | 10% | How quickly the visible page fills in |
Check the scoring page when a new major Lighthouse version comes out. Weights can change between major versions, and the documentation is where any change will be confirmed.
Scoring curves
Lighthouse does not score raw milliseconds directly. Each metric value is mapped onto a log-normal curve built from real-site data in the HTTP Archive. The curve turns, for example, an LCP time into an LCP score between 0 and 100.
The curve is S-shaped, so the same improvement is worth different points depending on where you start:
- Very slow pages: you are on the flat bottom of the curve. Cutting 300 ms from a very slow LCP may add almost nothing.
- Middle of the range: the curve is steepest here. The same 300 ms can move the metric score a lot.
- Already fast pages: the curve flattens again near the top. Further gains bring diminishing returns.
Mobile and desktop use separate scoring curves, and have done since Lighthouse v6. The same LCP time therefore produces different metric scores on each form factor.
The final score falls into one of three bands:
| Score | Band |
|---|---|
| 0–49 | Poor |
| 50–89 | Needs improvement |
| 90–100 | Good |
The Lighthouse scoring page links to a score calculator. Enter your own metric values to see how many points a given improvement would add before you spend time on it.
Why better simulated FCP and LCP can lift the score noticeably
Lighthouse 13.6.0 changed how Lantern simulates FCP and LCP. Together those two metrics carry 35% of the score.
If your page sits on the steep part of the LCP curve, a lower simulated LCP can lift its 25% share by a lot. A smaller FCP gain adds a little more on top. Neither of these needs any change to your site.
This is why JS-heavy pages are more likely to see movement. Barry Pollard noted that the change is not SPA-specific but is more likely to affect JavaScript-heavy sites (Barry Pollard on Bluesky). Search Engine Journal reported one example: before 13.6, preloaded JS modules could make simulated LCP worse even when the real page got faster (Search Engine Journal).
Only metrics count. Insights and diagnostics don’t
The Insights and Diagnostics sections in PSI (render-blocking requests, unused JavaScript, image delivery and so on) do not add or remove points directly. They only matter if fixing them improves one of the five metrics.
“PSI now flags fewer issues, so my score went up because the warnings were cleared.”
Not quite. The score moves only when the metric values move. Lighthouse 13 merged many audits into insights without changing scoring (Search Engine Journal). A shorter list of warnings is not the same as a faster page.
Step by step: confirm whether a score change is real or a tool change
Before you credit your developer (or blame a plugin update), work through these checks. They take about 20 minutes per URL and stop you reporting a tool change as a performance win.
Check the Lighthouse version
- Record the date and the Lighthouse version for every report. In the PSI web report, the version and run details are listed at the bottom of the lab data section. In the API response, read
lighthouseResult.lighthouseVersion. - Compare the versions of the two reports. If the old report ran on 13.5.x and the new one on 13.6.0, the two scores were not measured with the same simulation (Search Engine Journal). Treat them as different rulers.
- Check the release notes for that version. Read the Lighthouse 13.6.0 GitHub release and the PSI release notes. The PSI API stays on v5 while the Lighthouse version underneath it is updated on its own schedule. The PSI page may not list 13.6 yet, so the GitHub release is the more reliable source for now.
There is precedent for this. Lighthouse 12.2.3 adjusted the CPU throttling factor only for PSI. TBT improved for every site on PSI, while CLI and DevTools results were not affected (Lighthouse 12.2.3 release).
Compare observed vs simulated values
- Compare individual metrics, not just the score. Put the old and new values side by side. If FCP and LCP improved while TBT and CLS stayed flat, the pattern matches the 13.6.0 Lantern changes.
- Open the full JSON and compare observed and simulated values. PSI lab data always uses simulated throttling. Lighthouse loads the page on a fast connection, then estimates how it would load on a slower one. The JSON keeps both the observed (unthrottled) values and the simulated ones (DebugBear on simulated throttling).
Get the JSON from the PSI API, or use the PSI report menu to view or download the Lighthouse report. Then look in the metrics audit:
{
  "lighthouseResult": {
    "lighthouseVersion": "13.6.0",
    "audits": {
      "metrics": {
        "details": {
          "items": [
            {
              "firstContentfulPaint": 1800,
              "largestContentfulPaint": 2600,
              "observedFirstContentfulPaint": 420,
              "observedLargestContentfulPaint": 610
            }
          ]
        }
      }
    }
  }
}
The numbers above are illustrative placeholders, not real measurements. Values are in milliseconds.
How to read it:
| What you see | Likely meaning |
|---|---|
| Simulated FCP/LCP dropped, observed FCP/LCP roughly the same | The simulation changed, not the page |
| Observed and simulated values both dropped | The page may really be faster. Check deploys and field data |
| Simulated values worse, observed values better | A simulation quirk, similar to the pre-13.6 preload issue |
Observed values come from a fast test machine and won’t match what real users get. Use them for comparison between reports, not as your real-world speed.
Re-run and take the median
- Run the test 3–5 times and use the median. Lighthouse scores vary even when the code stays the same. Google’s variability guidance says the median of 5 runs is roughly twice as stable as a single run (Lighthouse variability docs).
Lighthouse CI can collect 5 runs through the PSI API, so you get the same environment PSI uses:
npm install -g @lhci/cli

lhci collect \
  --method=psi \
  --psiApiKey=YOUR_PSI_API_KEY \
  --url=https://www.example.com/ \
  -n 5
Check the current flag names in the Lighthouse CI documentation before you script this, because CLI options can change between versions.
- Check deploy logs and site changes for the same dates. Look at:
- Theme and plugin updates (WordPress records these in update logs if you use an activity log plugin)
- Caching, minification or image-optimisation setting changes
- CDN changes: new rules, HTTP/3 being turned on, a provider switch
- Third-party scripts added or removed (chat widgets, tag manager containers, review badges)
- Hosting or PHP version changes
If nothing changed in that window, the tool is the most likely cause. If something did, you have two possible causes. Use the observed values to separate them.
- Check whether the CrUX field data moved. Field data shows real Chrome users over a trailing 28-day period at the 75th percentile (PSI documentation). If field LCP and FCP are flat while the lab score jumped, treat the change as a tool change. Real-user improvements build up in the 28-day window over time, so recheck after two to four weeks before you draw conclusions.
Quick verdict table
| Version changed? | Site changed? | Field data moved? | Verdict |
|---|---|---|---|
| Yes | No | No | Tool change. Note it, take no action |
| Yes | Yes | Not yet | Mixed. Compare observed values and wait for the field data |
| No | Yes | Yes | Real change. Your work (or a regression) is showing up |
| No | No | No | Normal variability. Use the median of 5 runs |
If you report speed to clients, keep the version, date and median alongside every score. The same approach we use for accurate, Search Console-first SEO reporting works here too: measure with the same ruler, or say clearly when the ruler changed.
Not sure whether a jump on your WordPress or WooCommerce site is real? Start with a free SEO check, or book a free consultation and we can go through your PSI JSON and CrUX data together.
How to read CrUX field data properly
The field data block at the top of a PageSpeed Insights report comes from the Chrome UX Report (CrUX). It shows how real Chrome users experienced the page, not how a test machine loaded it.
This is why field data matters so much after a Lighthouse update. Lighthouse 13.6 changed how PSI simulates loading in the lab, but it did not change what your visitors experienced. If the lab score jumped and the field data did not move, your users did not get a faster site.
According to the PageSpeed Insights documentation, field data covers a trailing 28-day period and is reported at the 75th percentile (p75) for LCP, INP and CLS, plus FCP and TTFB. It does not feed into the Lighthouse Performance score.
This URL vs Origin
Before you read any number, check which scope you are looking at. PSI shows field data either for the exact URL you tested or for the whole origin (every page on that domain and protocol).
If a single URL does not have enough real-user data, PSI may fall back to origin-level data. That is easy to miss.
| Scope | What it describes | Use it for | Don’t use it for |
|---|---|---|---|
| This URL | Real users who loaded that exact page | Judging a specific template or landing page | Drawing conclusions about the whole site |
| Origin | Real users across all pages on the domain | A site-wide health check and long-term trend | Proving that one page is fast or slow |
A typical trap on a WooCommerce store is that the homepage passes at origin level, while product pages with large galleries and many plugins fail. Origin data is an average experience across the site. It does not describe any single page.
Reading p75 against the thresholds
p75 means 75% of page loads were at this value or better. You pass a metric when the p75 value is within the “good” threshold.
| Metric | “Good” at p75 | What a fail usually points to |
|---|---|---|
| LCP | 2.5 s or less | Slow server response, heavy hero image, render-blocking CSS/JS |
| INP | 200 ms or less | Heavy JavaScript on clicks and taps, third-party scripts |
| CLS | 0.1 or less | Images without dimensions, late banners, font swaps, injected ads |
These are the long-standing Core Web Vitals thresholds. Confirm them on web.dev’s Core Web Vitals pages before you put them in a client report, because Google publishes any threshold changes there first.
Why field data lags
Because CrUX is a rolling 28-day window, a fix you ship today only shows fully about four weeks later. In the first week, roughly three-quarters of the data still comes from the old version of the page.
Set expectations like this:
- Days 1–7: Lab data should change straight away. Field data may barely move.
- Days 7–21: Field p75 values start drifting in the right direction.
- Day 28 onwards: The window now reflects only the new version. Judge the fix here.
Timing matters this month. If you are fixing speed on sale pages for Black Friday (see Black Friday SEO for WooCommerce), changes shipped in early November will not be fully reflected in CrUX until around the start of December.
For weekly trends instead of a single 28-day snapshot, use the CrUX History API or Google’s CrUX visualisation tool (currently called CrUX Vis). Check developer.chrome.com for the current tool names and access, as Google has renamed and replaced CrUX tools before.
When there is no field data
Low-traffic pages often show no field data at all. That does not mean the page is fine or broken. It means not enough Chrome users loaded it in the last 28 days.
In that case:
- Use lab data for direction only, such as “LCP is driven by this image” or “this script blocks the main thread”. Don’t treat the score as a verdict.
- Open Search Console → Experience → Core Web Vitals. It groups similar URLs, so a quiet product page may be covered by its URL group.
- Fix problems at template level. A fix to the product template helps every product page, including the ones too quiet to measure.
“No field data means Google doesn’t care about this page’s speed.”
Not quite. It means there is no page-level CrUX data to report. Your users still experience the page, and similar pages in the same group may still be assessed. Treat it as a measurement gap, not a free pass.
Why mobile and desktop scores can’t be compared
PSI shows a Mobile tab and a Desktop tab, and clients often put the two numbers side by side. A mobile 70 and a desktop 90 are not two grades on the same test. They are two different tests.
Different test conditions
The mobile lab run emulates a mid-range phone with a slow network and CPU throttling. The desktop run uses a different, faster profile. As covered earlier, PSI uses simulated throttling: Lighthouse loads the page on a fast connection and then estimates how it would load under those conditions (DebugBear).
The same JavaScript bundle that takes a fraction of a second on desktop can create long tasks on an emulated mid-range phone. That drives Total Blocking Time up, and TBT carries 30% of the score.
Different scoring curves
Even with identical metric values, the scores would differ. Since Lighthouse v6, desktop has used its own scoring curves (Chrome for Developers: Lighthouse performance scoring). Each metric is mapped to a log-normal curve, and the desktop curves expect faster results.
| Mobile | Desktop | |
|---|---|---|
| Device emulated | Mid-range phone, slow network, CPU throttling | Desktop profile, faster conditions |
| Scoring curves | Mobile curves | Separate desktop curves (since v6) |
| Field data shown | Real Chrome users on phones | Real Chrome users on desktop |
| Search Console report | Core Web Vitals → Mobile | Core Web Vitals → Desktop |
Field data is split by device too
The CrUX block on each tab shows that device’s real users only. A page can pass on desktop and fail on mobile because the audiences, devices and connections are different.
Which one matters more depends on who visits. Many sites in Bangladesh and Australia get most of their traffic from phones, while some B2B sites in the UK and USA still have a strong desktop share. Don’t guess. Check it:
- In GA4, go to Reports → Tech → Overview and look at the Device category card.
- For more detail, open Reports → Tech → Tech details and switch the dimension to Device category.
- Compare sessions and conversions. A store may get 75% of sessions on mobile but most large orders on desktop.
If a large share of your traffic sits in “Unassigned” or looks odd, sort that out first (see GA4 Unassigned Traffic: Find and Fix the Causes), otherwise your device split may be skewed too.
Decision rule: report each device separately
Report and set targets for mobile and desktop separately, and never average the two. An average of 70 and 90 is 80, which describes neither test and hides the device that is failing.
A simple report format that avoids confusion:
Page: /product/leather-wallet/
Lighthouse version: 13.6.0 (PSI)

MOBILE  (≈78% of sessions in GA4)
  Lab score (median of 5): 64
  Field p75 (URL):  LCP 2.9 s | INP 180 ms | CLS 0.04
  Target: LCP ≤ 2.5 s at p75

DESKTOP (≈22% of sessions in GA4)
  Lab score (median of 5): 91
  Field p75 (origin fallback): LCP 1.8 s | INP 90 ms | CLS 0.02
  Target: hold current values
The figures above are an illustration of the layout, not real client data. Note the scope label on the field data and the Lighthouse version on every report. Both stop people from comparing numbers that were never comparable.
If you want a second opinion on which device and templates to prioritise, start with a free SEO check.
How to note the Lighthouse 13.6 update in client reports
If you send monthly speed reports, the Lighthouse 13.6 update will appear as a sudden jump in many lab scores. If you don’t explain it, clients will read it as progress. Worse, they may read it as proof that a recent change worked.
Lighthouse 13.6.0 was released on 27 October 2026. Its notes said it would reach PageSpeed Insights within a week (Lighthouse 13.6.0 release notes). Barry Pollard from the Chrome team has since confirmed it is live on PSI. He described the change as improving simulated FCP and LCP, which gives more accurate and usually better scores (Barry Pollard on Bluesky).
“Our mobile score went from 58 to 79 this week, so the optimisation work paid off.”
That conclusion is not safe. As Search Engine Journal points out, PSI scores from before and after 13.6 were not measured with the same simulation. Check the Lighthouse version and field data before you credit site work for a higher score (Search Engine Journal).
Find the exact switch date for your data
The rollout window runs from 27 October to early November 2026. The exact day your tests switched depends on when you ran them. Check it instead of guessing:
- Open a saved PSI report or API response from each test date.
- Look for the Lighthouse version at the bottom of the lab data section in the PSI interface.
- In API or stored JSON results, read the
lighthouseResult.lighthouseVersionfield. - The first date showing 13.6.0 is your annotation date.
{
  "lighthouseResult": {
    "lighthouseVersion": "13.6.0",
    "fetchTime": "2026-11-02T09:14:31.000Z"
  }
}
Also check the official PageSpeed Insights release notes. That page explains that the API stays at v5 while the Lighthouse version is updated on its own schedule. It may not list 13.6 yet, so use the GitHub release as your main reference.
Annotation wording
Add the note wherever the client sees the trend line. That might be a GA4 annotation on the report chart, a dated text note beside the speed chart in Looker Studio, or a row in your report’s change log. Keep the wording short, factual and free of blame.
[Date your PSI data first shows 13.6.0] – PageSpeed Insights moved to Lighthouse 13.6.0.

The lab Performance score changed because Google updated how Lighthouse
simulates page loading (FCP and LCP estimates). This change was not caused
by work on the site.

Lab scores before and after this date are not directly comparable.
Real-user (field) Core Web Vitals from CrUX are shown separately below and
are the measure of actual visitor experience.
If you finished speed work during the same week, record it as a separate annotation. Two overlapping changes need two notes, or nobody will be able to separate them later.
Resetting your baseline
Treat 13.6 as the start of a new lab series:
- Start a fresh baseline. Take the median of five runs per key template (home, category, product, article) on 13.6.
- Don’t present pre/post deltas as wins. A jump from 12.x or 13.5 to 13.6 is a measurement change.
- Keep old data, but label it. Mark pre-13.6 lab scores as “previous Lighthouse version” in charts and tables.
- Flag JS-heavy templates. Pollard noted the change is not SPA-specific but is more likely to affect JavaScript-heavy sites. Expect larger shifts on those pages.
Put field data first in the report
Reorder the speed section so the most meaningful data comes first:
| Order | What to show | Why |
|---|---|---|
| 1 | Core Web Vitals assessment (passed or failed), URL or origin level | This reflects real visitors |
| 2 | p75 LCP, INP and CLS, with the trend over 28-day windows | Shows direction without tool noise |
| 3 | Lab Performance score (median of five runs) plus Lighthouse version | A diagnostic signal, not an outcome |
| 4 | Top lab opportunities and insights | Explains what to fix next |
This follows the same principle as a Search Console-first SEO report. Lead with the data source closest to reality, and put the third-party or simulated numbers second.
Decision rule: when a PageSpeed score change needs action
Most score changes do not need a developer ticket. Before you act, answer three questions:
- Did the Lighthouse version change?
- Is the lab change repeatable across several runs?
- Did the field data move?
The answers point to one of the scenarios below.
The decision table
| Scenario | Lab change | Field change | Action |
|---|---|---|---|
| Tool update (e.g. 13.6) | Up, starting from the version switch date | Flat | No action. Annotate and reset the lab baseline. |
| Real regression | Down, same Lighthouse version, repeatable over 5 runs | Flat or starting to worsen | Investigate recent deploys, plugin updates, theme changes and new third-party scripts. |
| Threshold crossed | Any, including unchanged | p75 LCP, INP or CLS moves into a worse band | Act, whatever the lab score says. |
| Lab and field disagree | Good | Poor (or the reverse) | Trust the field for user experience. Use the lab to find causes. |
| Run-to-run noise | Differs only between single runs | Flat | No action. This is normal variability. |
Lab up, field flat, tool changed: annotate only
This is the typical pattern after 13.6. The simulation now estimates FCP and LCP differently. For example, SEJ reports that preloaded JS modules could previously make simulated LCP worse even when the real page got faster (Search Engine Journal). Your visitors’ experience did not change, so there is nothing to fix and nothing to celebrate.
Lab down, same version, repeatable: investigate
A drop that holds across five runs on the same Lighthouse version is worth chasing. Lighthouse’s own guidance says the median of five runs is roughly twice as stable as a single run (Lighthouse variability docs). To find the cause:
- List everything deployed since the last stable baseline.
- Compare the lab metric breakdown. TBT points to JavaScript, LCP to images, fonts or server response, and CLS to layout shifts.
- Roll back or disable the most likely change on staging and test again.
On WooCommerce stores, check this before peak trading. A slow category template during a sale costs real orders. See Black Friday SEO for WooCommerce for preparing sale pages.
Field p75 crosses a threshold: act
Field data is what Google uses to assess Core Web Vitals (PageSpeed Insights documentation). These are the bands to watch:
Metric   Good        Needs improvement   Poor
LCP      ≤ 2.5 s     2.5–4.0 s           > 4.0 s
INP      ≤ 200 ms    200–500 ms          > 500 ms
CLS      ≤ 0.1       0.1–0.25            > 0.25
A p75 metric moving into a worse band needs attention, even if the lab score reads 95. CrUX uses a trailing 28-day window, so the cause may date back two to four weeks.
Lab and field disagree: use each for its job
Lab tests run once, on one simulated device, without real user interactions. That means they can miss INP problems and slow real-world networks. Use the field data to decide whether there is a problem, and the lab to work out why.
Single-run differences: ignore them
Lighthouse scores change even without code changes. A five-point swing between two single runs tells you nothing. If you want an outside view of what really needs fixing, start with a free SEO check or book a free consultation.
Common mistakes after a Lighthouse update
A Lighthouse update doesn’t break anything on your site. The damage comes from how people react to the new numbers. These are the mistakes to avoid while Lighthouse 13.6 settles in.
1. Comparing screenshots from different Lighthouse versions
A PSI screenshot from September and one from this week look the same. They aren’t. Search Engine Journal points out that scores from before and after 13.6 were not measured with the same simulation (Search Engine Journal).
Before you compare two lab results, check the Lighthouse version. PSI shows it at the bottom of the lab data section, next to the capture time and emulated device. If the versions differ, treat the comparison as directional at best.
- Same version, same device, median of several runs: fair comparison.
- Different versions: don’t present the difference as a result of site work.
- No version recorded: assume it can’t be compared.
2. Chasing a 100 score instead of passing Core Web Vitals
“If we get the mobile score to 100, our rankings will go up.”
The Lighthouse Performance score is a lab diagnostic. It isn’t the data Google uses to assess page experience. CrUX field data does not feed into the Lighthouse score, and the score doesn’t feed into CrUX (PageSpeed Insights documentation).
The useful target is real users passing LCP, INP and CLS at the 75th percentile. A page scoring 82 that passes all three in the field is in better shape than a page scoring 97 with failing INP. Spend developer time on the field metric that fails, not on the last few lab points.
3. Comparing PSI to DevTools Lighthouse before Chrome 159 ships 13.6
Lighthouse 13.6 is live on PSI, but the release notes say it ships in DevTools with Chrome 159. SEJ reports that Chrome 159 stable is due in December. Until then, the Lighthouse panel in your local Chrome is probably running an older version.
So a lower score in DevTools than in PSI is expected right now. Several things differ between the two:
| Factor | PageSpeed Insights | DevTools Lighthouse (local) |
|---|---|---|
| Lighthouse version | 13.6.0 | Whatever ships with your Chrome version |
| Hardware | Google’s servers | Your laptop, with its own CPU load |
| Network location | Google’s data centre | Your office or home connection |
| Throttling settings | Simulated, PSI-specific settings | Panel settings you can change |
| Extensions and cache | Clean environment | Can interfere unless you use a clean profile |
Throttling can also be tuned for PSI alone. In Lighthouse 12.2.3, the CPU throttling factor was adjusted only for PSI. TBT improved for every site on PSI, while CLI and DevTools results didn’t change (Lighthouse 12.2.3 release notes). Check the version at the bottom of the DevTools report before comparing.
4. Treating origin field data as page data
If a URL doesn’t have enough CrUX data, PSI may show origin-level data instead. That number describes your whole site, not the page you tested.
For a WooCommerce store, origin data mixes fast blog posts with heavy category pages and checkout. A “pass” at origin level can hide a failing product template. Look for the label saying the data is for the origin. When you see it, use Search Console’s Core Web Vitals report or your own RUM data to judge individual templates.
5. Removing JS module preloads because 13.5 penalised them
SEJ notes that before 13.6, preloaded JS modules could make simulated LCP worse even though the real page got faster. If you or a plugin removed module preloads to please Lighthouse 13.5, you may have optimised for a simulation quirk.
- List any preloads removed in the last few months, and why.
- Re-test the affected templates on PSI with 13.6, using the median of several runs.
- Check field LCP for the same templates before and after the original change.
- Restore a preload if the field data shows it helped real users.
6. Using a single run as evidence
Lighthouse’s own variability documentation says scores change even when the code doesn’t. The median of 5 runs is roughly twice as stable as a single run (Lighthouse variability documentation).
One PSI run before a change and one after doesn’t prove anything. Run at least five tests, take the median, and keep the raw results. If you report speed to clients, use the same standard you’d apply to rankings. My guide to Search Console-first SEO reporting covers the same thinking: measure consistently and label anything that changed the measuring tool.
Advanced monitoring: tracking speed without being fooled by tool changes
The 13.6 update won’t be the last scoring or simulation change. A monitoring setup that records context alongside each score lets you separate tool changes from site changes in minutes.
Store the Lighthouse version with every result
If you pull results from the PSI API into Google Sheets, Looker Studio or BigQuery, log more than the score. The API response includes the Lighthouse version in lighthouseResult.lighthouseVersion. Without that field, a version jump looks exactly like a site improvement.
A basic API request looks like this:
https://www.googleapis.com/pagespeedonline/v5/runPagespeed
  ?url=https://example.com/product/blue-mug/
  &strategy=mobile
  &category=performance
  &key=YOUR_API_KEY
The API itself stays at v5, while the Lighthouse version behind it is updated regularly (PSI release notes). That page may not list 13.6 yet, so check the GitHub release as well.
Log these fields for every test:
| Column | Where it comes from | Why it matters |
|---|---|---|
| Date and time | lighthouseResult.fetchTime |
Lines up results with deployments |
| URL and template | Your own label | Groups product, category and checkout pages |
| Device | strategy parameter |
Mobile and desktop use different scoring curves |
| Lighthouse version | lighthouseResult.lighthouseVersion |
Flags tool changes |
| Median score of 5 runs | Calculated from categories.performance.score |
Reduces run-to-run noise |
| Median LCP, TBT, CLS | audits[...].numericValue |
Shows which metric moved |
| Field p75 LCP, INP, CLS | loadingExperience.metrics |
Real-user outcome |
| Field data scope | Check whether the data is page or origin level | Avoids mistaking origin data for page data |
| Site changes | Your deployment log | Explains real shifts |
For repeated runs outside PSI, Lighthouse CI can collect five runs per URL:
lhci collect --url=https://example.com/ --numberOfRuns=5The variability documentation explains how Lighthouse CI can also collect runs in PSI mode, so your median reflects PSI’s environment rather than your build server.
In your chart, add a vertical marker whenever lighthouseVersion changes. Any jump that lands on that line should be investigated as a tool change first.
Set alerts on field data, not the lab score
Lab scores move with every Lighthouse update. Field p75 metrics only move when real users’ experience changes, so that’s where alerts belong.
- Alert when p75 LCP goes above 2.5 seconds.
- Alert when p75 INP goes above 200 milliseconds.
- Alert when p75 CLS goes above 0.1.
- Treat lab score drops as a prompt to investigate, not as an alert.
Remember that CrUX covers a trailing 28-day period. A regression shipped today will take time to show fully in PSI field data. For faster warnings, you need your own real-user data.
Real-user monitoring
Google’s open-source web-vitals JavaScript library measures LCP, INP and CLS in real visitors’ browsers. You can send the values to your own endpoint or to GA4 as events.
import {onLCP, onINP, onCLS} from 'web-vitals';

function sendToEndpoint(metric) {
  const body = JSON.stringify({
    name: metric.name,
    value: metric.value,
    rating: metric.rating,
    id: metric.id,
    page: location.pathname
  });
  navigator.sendBeacon('/vitals', body);
}

onLCP(sendToEndpoint);
onINP(sendToEndpoint);
onCLS(sendToEndpoint);
Commercial RUM tools offer dashboards and alerting with less setup. The trade-off is that every third-party script runs with access to your pages. On 31 October 2026, DebugBear told customers to remove its RUM script after a DNS hijack (Search Engine Journal).
Lower the risk with a few habits:
- Self-host the
web-vitalslibrary where you can, rather than loading it from a third-party domain. - Keep a list of every third-party script, who owns it and how to remove it quickly.
- Follow your vendors’ security notices, and act on them the same day.
- On WooCommerce, keep monitoring scripts off checkout unless you genuinely need data there.
Record new baselines for WordPress and WooCommerce templates
WordPress sites share templates, so you don’t need to test every URL. Re-test one representative URL per template on 13.6, then record the results as your new baseline.
- Home page: usually the heaviest on sliders and third-party scripts.
- Category page: product grids, filters and lazy-loaded images. If you use layered filters, see my guide to faceted navigation SEO for WooCommerce.
- Product page: gallery, variation scripts and review widgets.
- Checkout: payment scripts and fragments, where INP problems cost sales directly.
- Blog post: a useful control page with few plugins involved.
Run five mobile and five desktop tests for each template. Note the median, the Lighthouse version and the date in your log. With peak trading close, it’s worth doing this before any Black Friday sale page changes go live, so you can tell your own changes from tool changes.
If you’d like a second opinion on your speed data or monitoring setup, start with a free SEO check or book a free consultation.
Frequently Asked Questions
Why did my PageSpeed Insights score go up when I changed nothing?
PSI now runs Lighthouse 13.6.0, which estimates FCP and LCP differently in its Lantern simulation. The lab score can rise even though the page is identical. Check the Lighthouse version in the run details and compare your field data before crediting any work.
Does a higher PageSpeed Insights score improve my Google rankings?
The 0–100 Performance score is a lab estimate and is not what Google uses to assess real user experience. Google's page experience guidance refers to Core Web Vitals measured from real Chrome users. Watch the field data in PSI and the Core Web Vitals report in Search Console instead.
Why is my Chrome DevTools Lighthouse score different from PSI?
They may be running different Lighthouse versions. PSI updated to 13.6.0 first, while Lighthouse 13.6 ships in DevTools with Chrome 159, due in December. Different hardware, network conditions and throttling setups can also produce different results.
Why does my PSI score change every time I run the test?
Each lab test is a single page load, so server response times, network conditions and third-party scripts vary between runs. Run the test several times and look at the typical result rather than one number. For trends, rely on field data, which covers a 28-day window.
How long does it take for field data to show a speed improvement?
CrUX field data covers a trailing 28-day period, so a fix shipped today only affects a small share of the data at first. Expect a gradual change over several weeks. Low-traffic URLs may show origin-level data or no field data at all.
Should I compare PSI scores from October with scores from November?
Not directly, if one was produced before Lighthouse 13.6.0 and one after. The simulation changed, so the difference may reflect the tool rather than your site. Record the Lighthouse version with every score you report so comparisons stay fair.
Which PageSpeed Insights data should I report to clients or managers?
Lead with field data: the Core Web Vitals assessment and the 75th percentile LCP, INP and CLS values. Use lab data to explain causes and test fixes. Always note the Lighthouse version beside any lab score.
Final Thoughts
If your PageSpeed Insights score changed recently, first check the Lighthouse version in the run details. A jump after Lighthouse 13.6.0 is not proof your site got faster.
Next, open the field data in PSI and the Core Web Vitals report in Search Console. If those numbers have not moved, real users have not noticed a change, whatever the lab score says.
From now on, record the Lighthouse version with every score you report, judge results with field data, and use lab data to find what to fix. If you are unsure whether a speed problem is real, start with a free SEO check and compare it with your field data before spending development time.
Want help applying this to your site? Run the free SEO check or book a free consultation with MD Harunur Rashid. Free SEO check · Book a free consultation