If your rank tracker showed sudden drops in late September or October 2026, check rank tracking accuracy before you blame your rankings. Vendor research suggests some trackers have been saving wrong but normal-looking results pages as real data.
This matters because a confident drop on a chart can lead to panic, wasted fixes and difficult client calls, even when nothing changed for real users.
The timing makes it harder to read. The worst of the problem overlapped with Google’s September 2026 spam update, so real drops and false drops are mixed together in the same weeks.
This article covers what vendors have reported about poisoned SERPs and what Google has and hasn’t said. It also explains how Search Console calculates average position and why your own searches never match it.
It ends with a Search Console-first reporting order you can use from this month onward.
It is written for small business owners, WooCommerce store owners, marketers and in-house SEOs who report rankings to a client, a manager or themselves.
Key Takeaways
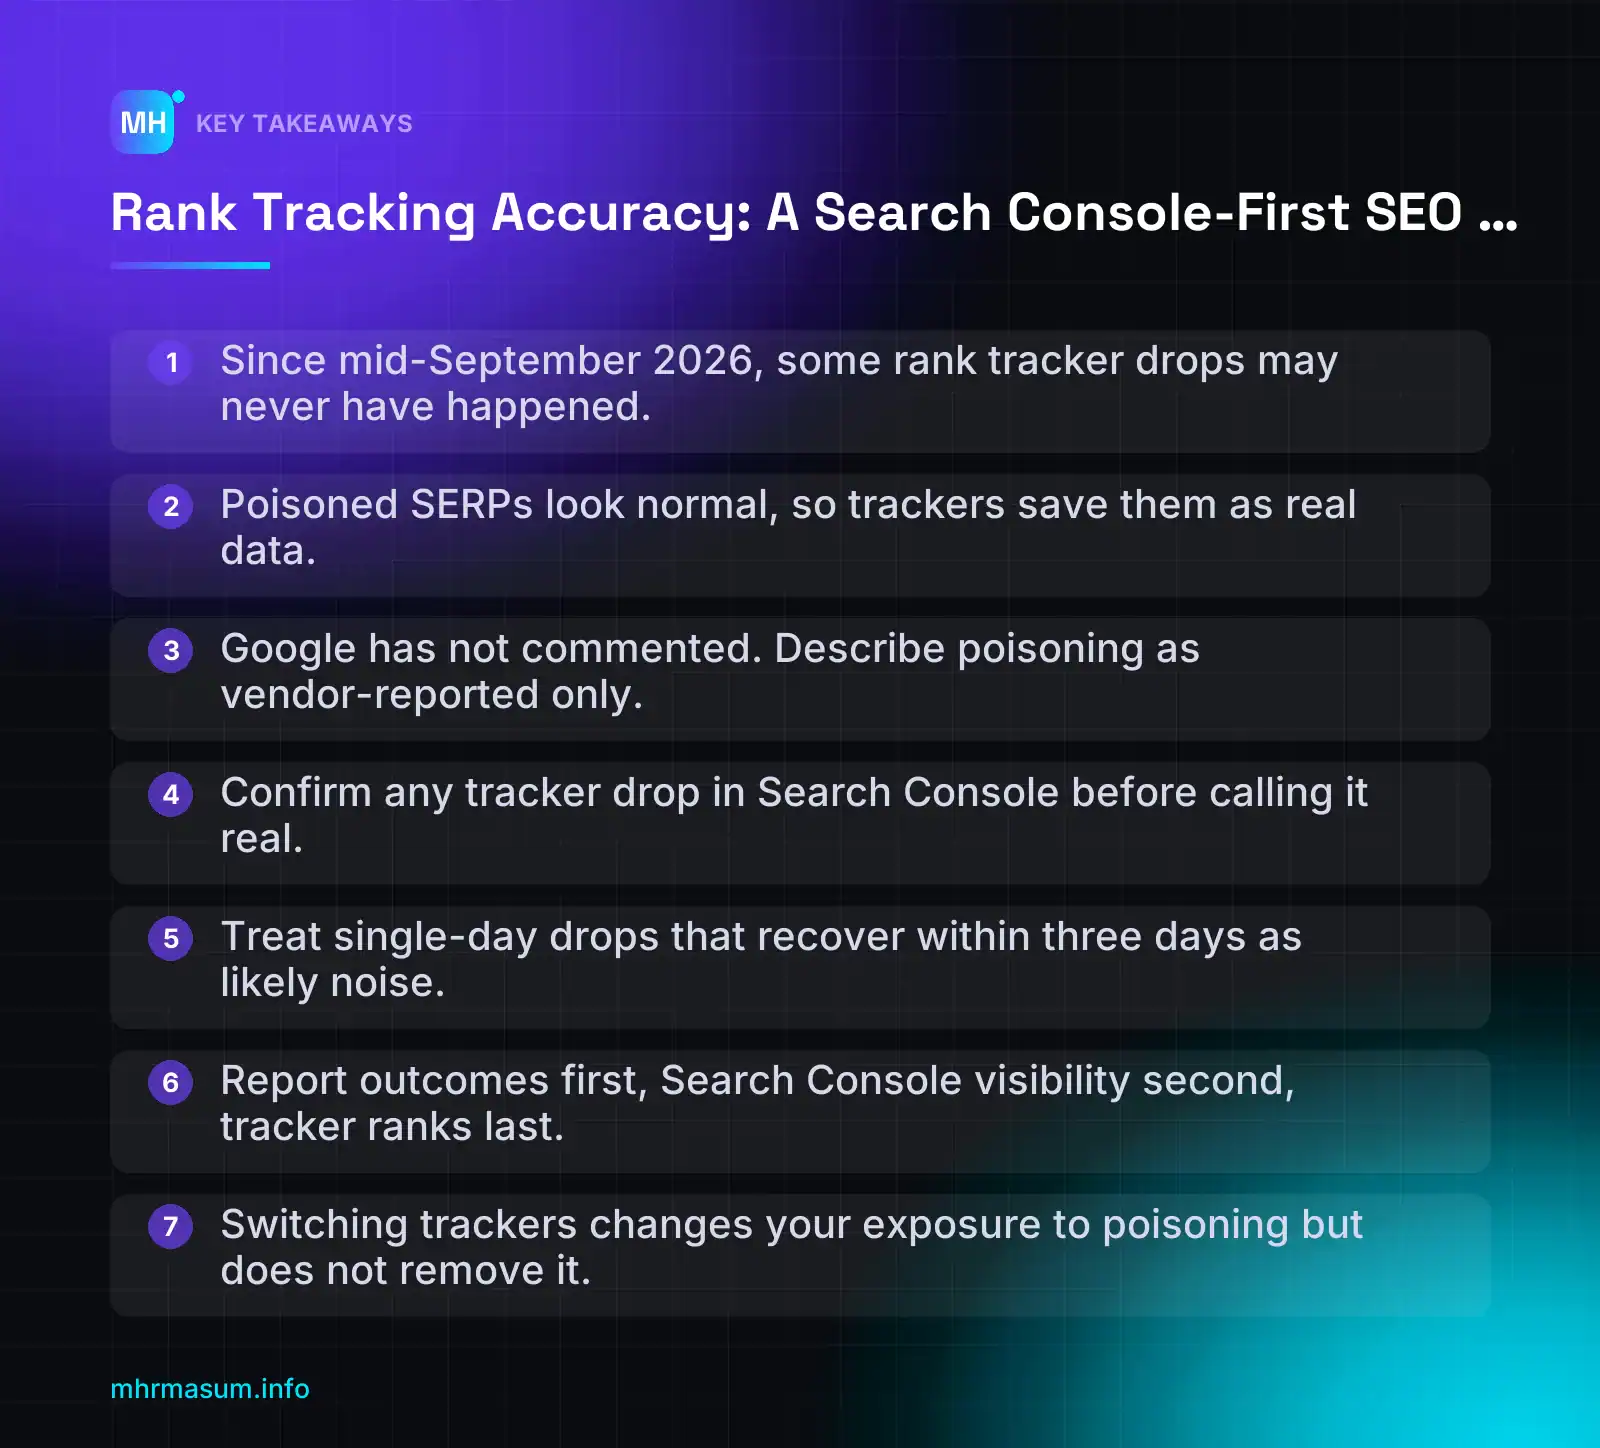
- Since mid-September 2026, some rank tracker drops may never have happened.
- Poisoned SERPs look normal, so trackers save them as real data.
- Google has not commented. Describe poisoning as vendor-reported only.
- Confirm any tracker drop in Search Console before calling it real.
- Treat single-day drops that recover within three days as likely noise.
- Report outcomes first, Search Console visibility second, tracker ranks last.
- Switching trackers changes your exposure to poisoning but does not remove it.
What is happening to rank tracker data right now
Since mid-September 2026, rank tracker data has become much less reliable. Some tools may be recording drops that never happened.
Before you report a lost position to a client or manager, you need to know what changed and what is still unconfirmed.
The clearest data comes from Nozzle, a rank-tracking vendor. On 10 October 2026 it published research showing that Google had been answering some tracker requests with complete, normal-looking results pages in which the results had been swapped out (Nozzle).
Nozzle’s headline findings:
- 8.0% of 17.8 million judged SERPs were “poisoned” between 13 September and publication. The rate before that was 0.17%.
- The 27.5 million figure you may see quoted is the number of SERPs collected, not judged (Elsop).
- Poisoning peaked at 27.0% on 29 September. It has run at about 5–11% a day since 1 October.
- 77.9% of affected keywords recovered within three days.
- The pattern appeared across 49 countries (Relevant Audience).
- 80% of poisoned spells lasted a single fetch (DEV Community).
Nozzle is not the only vendor reporting problems:
- Morningscore saw truncated results.
- Sistrix saw results that differed significantly from normal.
- DemandSphere reported a rate of about 11% (Elsop).
Poisoned SERPs vs blocked requests
A blocked request is an honest failure. The tracker gets an error, a CAPTCHA or an empty page. Most tools then show a gap, retry or flag the keyword.
A poisoned SERP is a dishonest success. The page loads and looks complete. It has ten results, normal snippets and normal features.
Because nothing looks broken, the tracker saves the page as real data. Your chart then shows a confident drop with no warning attached.
Search Engine Journal’s analysis makes the same point. Google is not refusing these requests. It is answering them with wrong results (Search Engine Journal).
Poisoned pages tend to have three signs:
- Artificial volatility.
- More user-generated content, such as forum and Reddit-style results.
- Fewer AI Overviews. Nozzle measured AI Overviews on 34.9% of poisoned pages, against 54.2% normally (DEV Community).
None of these signs is visible on a single page. Only the keyword’s own history reveals the problem. For example, a keyword that holds position 4 for weeks, falls to “not in top 100” for one day, then returns to position 4.
Practitioners on Search Engine Roundtable describe the problem in two stages. First trackers were blocked, then they were poisoned. They also list other changes that already made tracking harder:
- The
num=100parameter no longer works. - Results pages now require JavaScript.
- Many trackers sample rather than check every keyword every day.
That means some daily swings are simply measurement noise (Search Engine Roundtable).
Why two trackers can disagree on the same day
The poisoning rate depends on how a tool collects its data. On the same days, one Nozzle collection route returned 1–7% poisoned SERPs while another returned 9–30% (Nozzle).
The rate also varies by country and by vendor. Some tools appear to have recovered better than others, but no independent comparison confirms which ones.
In practice, this means:
- Two tools can show different positions for the same keyword on the same day, and neither may be right.
- Switching trackers does not solve the problem. It only changes your exposure to it.
- A single tool’s daily line is not evidence of a ranking change.
What Google has and hasn’t said
Google has not commented on poisoned SERPs. Everything above is vendor-reported. It comes from companies that run trackers and have analysed their own data.
Nozzle’s view is that Google is probably targeting AI scraping and grounding, and that rank trackers are caught in the same net (Search Engine Journal). That is a reasonable theory, but it is not confirmed. In client reports, describe it as “vendor-reported” and nothing stronger.
For a running summary of the story, see Search Engine Journal’s SEO Pulse from 17 October (Search Engine Journal).
The timeline overlap you need to know about
The worst of the poisoning happened at the same time as a real Google update. That makes September and October 2026 especially hard to read.
| Date (2026) | Event |
|---|---|
| 13 Sep | Nozzle’s elevated poisoning rate begins |
| 24 Sep (~12pm ET) | September 2026 spam update starts rolling out |
| 25–27 Sep | Volatility wave |
| 29 Sep | Poisoning peaks at 27.0% |
| 30 Sep | Volatility wave |
| 1 Oct onward | Poisoning runs at about 5–11% a day |
| 4–6 Oct | Volatility wave |
| 8 Oct (4:37am ET) | Spam update rollout completes |
| 16 Oct | New spike in ranking chatter; manual actions reported to be rising |
Sources: Search Engine Roundtable for the update and volatility dates, and Nozzle for the poisoning rates.
Because most poisoned SERPs fall inside the spam-update weeks, tracker charts of that rollout may be partly wrong. A “spam update drop” in your tool could be real, poisoned, or both.
Search Console was also affected. Its data fell almost three days behind that week (getlooploop). Check that your date range only includes complete days before you compare anything.
If you suspect a real update hit, work from Search Console data and use the core update recovery checklist. Do not start from tracker screenshots.
“My tracker says we dropped out of the top 10, so we lost rankings.”
Not necessarily. According to Nozzle, a tracked site missed the top 10 58.6% of the time on poisoned SERPs, compared with 2.7% on normal ones (Nozzle).
A sudden fall out of the top 10 is exactly what poisoning looks like. Before you call it a loss, check three things:
- Does Search Console show the same drop in impressions and position for that query?
- Did the drop last more than three days?
- Do other tracked keywords on the same page show the same pattern?
Why scraped rankings were never the full picture
Poisoning made the problem obvious, but rank trackers always had limits. A tracker records one fetch, from one location, on one device, at one moment.
Your customers see something different. Results vary by location, device, search history, time of day and SERP features. A single scrape is one sample from all of those possible results.
Search Console works the other way round. It records the impressions Google actually showed to real users and summarises them.
Here is what each source typically stores for one keyword on one day:
Rank tracker (one record per keyword per day)
  keyword:   "hiking backpack 40l"
  location:  London, GB
  device:    desktop
  fetched:   2026-10-14 06:12 UTC
  position:  6

Search Console (aggregated from real impressions)
  query:        "hiking backpack 40l"
  date:         2026-10-14
  impressions:  [all real impressions that day, all locations/devices in filter]
  clicks:       [real clicks]
  position:     [average of topmost position across those impressions]
The tracker’s 6 is a snapshot. Search Console’s figure is a summary of what users actually saw.
How Search Console calculates average position
Google defines position as the topmost position of your link, averaged across all impressions (Search Console Help).
The definition has four details that matter in reporting:
- Topmost only. If your site appears at positions 3 and 7 in one search, Search Console records 3.
- Google Search only. Position is shown for Search results, not for Discover or Google News.
- Counted top to bottom, primary side first. Positions run down the main column first, then the secondary side of the page.
- Chart and table differ. In the chart, position is the topmost result from your whole site. In the table, it is calculated per row, whether that row is a query or a page (Search Console Help).
Google also says this calculation method might change. Re-read the help page if a position trend shifts for no obvious reason.
Here is a simple illustration of how averaging works. The numbers are made up to show the maths:
Impression 1: topmost position 2
Impression 2: topmost position 2
Impression 3: topmost position 9   (e.g. a different location)
Impression 4: topmost position 3

Average position = (2 + 2 + 9 + 3) / 4 = 4.0
No single user saw position 4.0. That is normal. Average position describes a distribution, not a fixed spot.
Why your manual check doesn’t match Search Console
Clients often search a keyword themselves, see a different position, and decide Search Console is wrong.
John Mueller has explained that Search Console data comes from real results shown to users. Differences from manual checks usually come from three causes (Search Engine Journal):
- Personalisation. Your own search history and signed-in state affect what you see.
- Geo-targeting. A search from Dhaka, Sydney or Manchester can return different results.
- Short-lived visibility. You may rank briefly, for example during a test or a fresh-content boost, and those impressions still count in the average.
Branded searches add more variation, so separate them before you judge position trends. The branded vs non-branded guide shows how.
Comparing the four data sources
| Source | What it measures | Update lag | How far to trust it now |
|---|---|---|---|
| Rank tracker position | One scraped SERP from a set location, device and time | Same day or daily, depending on the tool and plan | Low for single-day moves. Use it as a diagnostic only. Poisoning and sampling make daily swings unreliable. |
| GSC average position | Topmost position averaged across real impressions | Usually a few days for final data. It slipped almost three days behind in early October 2026. | High for trends over 7–28 days. Read it alongside impressions, because position can rise while visibility falls. |
| GSC clicks and impressions | Real impressions and clicks from Google Search | Same as above. Fresh data is available but may change. | High. This is your best visibility evidence. Query rows can be omitted for privacy, so query totals will not match chart totals. |
| GA4 organic sessions | Sessions on your site attributed to organic search | Typically within a day or two, but check processing status for recent days | High for outcomes if tracking and consent are set up correctly. Attribution gaps are tracking problems, not ranking problems. |
A measurement break does not mean performance dropped. GA4 shows the same pattern: ChatGPT referral “drops” recently turned out to be links missing UTM tags (Search Engine Journal).
AI features add another gap. Google has said it will not show click data for its updated AI Mode and AI Overview links (Search Engine Roundtable). Check Google’s current wording before you quote this to a client. For what Search Console does report, see generative AI performance reports.
Decision rule: what goes in the report, and in what order
Use this order in every monthly report:
- Outcomes first. Organic clicks, leads, sales and revenue. Use GA4 for leads and revenue, and Search Console for clicks. These are what the business pays for.
- Visibility second. Search Console impressions and average position for priority queries and pages, compared over matching periods.
- Tracker ranks last, as a diagnostic. Use them to spot a page losing a SERP feature, or to see which competitor moved. Do not use them to prove a gain or a loss.
If a tracker drop does not appear in Search Console impressions within the same period, treat it as unconfirmed and leave it out of the headline.
If you are not sure which of your recent drops are real, start with a free SEO check. It uses your Search Console data rather than scraped positions.
The Search Console-first reporting stack
If a tracker can be fed a swapped-out results page, it should not be the base of your report. Put the data Google records from real searches at the bottom of the stack, and treat everything else as supporting evidence.
The stack below has four layers. Each one answers a different question. When two layers disagree, the lower layer usually wins.
Layer 1: GSC Performance report
Question it answers: How did Google Search actually show and send traffic to this site?
Search Console data comes from results shown to real users. John Mueller has explained that differences from manual checks usually come from personalisation, geo-targeting or short-lived visibility (Search Engine Journal). That makes it the only source here that the tracker poisoning cannot reach.
Understand what “average position” means before you report it:
- It is the topmost position of your link, averaged across all impressions (Search Console Help).
- It is counted top to bottom on the main side of the page, then the secondary side. Google says this method might change.
- In the chart, it uses the topmost result from the whole site. In the table, it is calculated per row (Search Console Help).
- Queries with no impressions have no position. A missing query is not the same as “ranked 100+”.
How often: a quick check every week for sudden changes, and a full review every month.
Layer 2: GA4 landing pages
Question it answers: Did the organic visits turn into enquiries, sales or other key events?
GA4 cannot see search queries. Google does not pass the keyword to your analytics. The Search Console link in GA4 imports GSC data, but GA4’s own sessions and conversions are still not split by query.
So you join the two by landing page:
- In GSC, list the queries for a priority page (Page filter, then the Queries tab).
- In GA4, open Reports > Engagement > Landing page and add a filter for Session default channel group = Organic Search.
- Match the rows on URL path. GSC shows the full URL (
https://example.com/boots/), while GA4 shows the path (/boots/), sometimes with query strings attached. Normalise both before you join them.
This gives you a valid statement such as “the hiking boots cluster drives this page, and this page produced [X] purchases”. It does not give you revenue per keyword, so don’t claim that.
If AI assistants send you traffic, keep it separate from Google organic. See how to track AI referral traffic in GA4.
How often: monthly, alongside the GSC review.
Layer 3: Manual SERP spot checks
Question it answers: What does the results page look like right now for a specific query and location?
Use spot checks to see SERP features, competitors and intent. Use them as well to confirm or reject a tracker alert. They are a sample of one, so they never override a month of GSC data. Section 7 covers a method you can defend in a meeting.
How often: only when something needs explaining, plus a few priority queries each month.
Layer 4: Rank tracker as a secondary signal
Question it answers: What changed between GSC updates, and how are competitors moving?
Trackers are still useful for competitor visibility, SERP feature history and queries where you get too few impressions for GSC to show. But Nozzle reports that 80% of poisoned spells lasted a single fetch and 77.9% recovered within three days (Nozzle). A one-day drop is an alert to check, not a finding to report.
How often: look at it weekly, but report from it only after GSC agrees.
| Layer | Role | Typical data lag | Known blind spots | Owner | Check |
|---|---|---|---|---|---|
| 1. GSC Performance | Source of truth for impressions, clicks, CTR and position | About 2–3 days for finalised data; fresh data is partial | Anonymised queries are omitted, UI export is capped at 1,000 rows, position is an average | SEO lead | Weekly scan, monthly report |
| 2. GA4 landing pages | Business outcomes from organic sessions | Usually within a day or two; check the latest dates before you report | No queries, consent and ad-blocker gaps, attribution model choices | Analytics / marketing | Monthly |
| 3. Manual spot checks | SERP layout, features, competitor context | Real time | Personalisation, location, a single sample | SEO lead | As needed, plus a monthly sample |
| 4. Rank tracker | Early warning and competitor trends | Daily | Vendor-reported poisoned SERPs, sampling, collection-route differences | SEO executive | Weekly; never reported alone |
Always label partial days
Finalised GSC data normally runs about two to three days behind. During the spam-update week, Search Console fell almost three days behind (getlooploop).
A chart that ends on a half-counted day looks like a cliff. Mark the last complete date on every chart and end comparisons on that date. GSC days run on Pacific time (America/Los_Angeles), so a “Monday” for an Australian or Bangladeshi client does not match their local Monday.
Step-by-step: build the monthly report in Search Console
This is the core report. It replaces “here are your 200 tracked keywords” with a smaller set of numbers based on real impressions.
Set comparisons correctly
- Open Performance > Search results. Check that the search type is Web.
- Click the Date filter and open the Compare tab.
- Choose Compare last 28 days to previous period. Twenty-eight days is exactly four weeks, so both ranges have the same mix of weekdays.
- For seasonal sites, such as outdoor gear, gifts or tax services, add a second view: Compare last 28 days year over year.
- Better still, use Custom and end both ranges on the last finalised day. The preset ranges can end on a day that is still filling in.
- Tick all four metrics: clicks, impressions, CTR and average position.
“Just compare September with August. A month is a month.”
Calendar months have different lengths and different numbers of weekends. A B2B site with one extra weekend in a month will show a “drop” that is really just fewer workdays. Compare equal-length ranges that start on the same weekday. Year-over-year ranges shift by one weekday, so say so if that matters for the client.
Filters that replace keyword tracking
Use + Add filter to slice the report the way a client thinks about their business:
- Page: your priority URLs, such as category pages, top products and service pages. Use “URLs containing” for a whole section, such as
/hiking-boots/. - Country: Australia, United Kingdom, United States or Bangladesh. A site can hold steady overall while losing its main market.
- Device: mobile and desktop rank and click differently. Report them separately when they diverge.
- Search appearance: shows rich result types and similar appearances where they apply, which helps explain CTR changes when your position has not moved.
For AI Overviews and AI Mode visibility, see the guide to Search Console generative AI performance reports.
Brand vs non-brand split with regex
Branded queries hide real SEO movement. If branded demand rises, the totals look healthy while generic visibility falls.
Use Add filter > Query > Custom (regex), then choose Doesn’t match regex for non-brand traffic:
Non-brand (Doesn't match regex):
(?i)yelly\s?stone|yellystoneoutdoors

Query cluster (Matches regex):
(?i)hiking\s?boot(s)?
You may see a combined pattern like (?i)^(?!.*brandname).*hiking boots.*. Search Console uses RE2 regex syntax, which does not support lookaheads, so that pattern will fail in the interface. It works in Python and similar tools.
If the interface won’t let you stack both conditions, run the cluster filter on its own and remove branded rows in your spreadsheet. You can also use two query filters in one API request, which are combined with AND (covered in section 5). For a deeper method, read branded vs non-branded SEO in Search Console.
Build a tracked keyword set from GSC, not the tracker list
Tracker lists are often chosen at onboarding and then forgotten. Build your keyword set from queries that already earn impressions.
- Set the date range to the last three months and open the Queries tab.
- Apply your non-brand filter and sort by impressions.
- Export the list. The UI export stops at 1,000 rows, which is enough for this step.
- Check week by week. Keep queries with steady impressions and drop one-week spikes.
- Choose 20–50 queries that match pages you care about commercially.
- Group them into 4–8 clusters, for example “hiking boots”, “waterproof jackets” and “camping stoves”.
- Save each cluster as a regex so next month’s report takes minutes.
The Search Console query groups guide shows how to find these clusters.
Report position per cluster, not per site
Site-wide and page-level average position is distorted by long-tail queries. When a page starts appearing at position 40 for dozens of new long-tail searches, its average position gets worse even if its main rankings have not moved. In that case, impressions went up and visibility actually improved.
| What you report | Why it misleads or helps |
|---|---|
| Site average position | Mixes brand, long tail and every page. Avoid it as a headline. |
| Page average position | Still diluted by new long-tail impressions. Use it with care. |
| Cluster average position plus impressions and clicks | Stable comparison over time. Use this as the headline. |
Also, Search Console can leave out rows because of internal limits, including anonymised queries. Your query rows will not add up to the chart totals, and that is expected.
Mistake to avoid
- Comparing ranges with different weekday mixes, such as 30 days against 31 days or a calendar month against a calendar month.
- Including incomplete days at the end of the current range. The last day or two will always look like a drop.
- Reporting the September spam-update weeks (24 September to 8 October 2026) from tracker charts alone. Most of the vendor-reported poisoned SERPs fall inside that same window.
If you want a second opinion on your current setup, start with the free SEO check.
Pulling query-level positions with the Search Console API
The Performance report is fine for a monthly overview. But for rank tracking accuracy at query level, you need the raw rows behind the chart.
The Search Console API gives you those rows. They come from the same real-user data the report uses, with no scraping involved.
Why the UI export is not enough
- UI table exports are capped at 1,000 rows. A small service site may fit inside that. A WooCommerce store with hundreds of products will not.
- The API also returns 1,000 rows by default, but you can raise
rowLimitto 25,000 per request and page through the rest withstartRow(Google for Developers). - Bulk Data Export to BigQuery has no practical row cap. It is the better choice for large sites or agencies that report on many properties.
A daily query and page pull
This request returns one row per query, page and day. Send it as a POST to the searchAnalytics.query method for your property, for example sc-domain:example.com.
{
  "startDate": "2026-09-01",
  "endDate": "2026-10-14",
  "dimensions": ["query", "page", "date"],
  "type": "web",
  "rowLimit": 25000,
  "startRow": 0,
  "dataState": "final"
}
To paginate, repeat the same request with startRow set to 25000, then 50000, and so on. Stop when a response returns fewer rows than your rowLimit, or none at all.
- Store every row with its date. This gives you a daily position history per query and page.
- Treat
positionin each row as the average topmost position for that query–page pair on that day (Search Console Help). - Weight positions by impressions when you roll them up. A query with 3 impressions should not move your average as much as one with 3,000.
Your query totals will not match the chart totals. Google omits some rows because of internal limits, including anonymised queries (Google for Developers). Report the gap. Do not try to “fix” it.
Using dataState and first_incomplete_date
The dataState setting decides whether you get settled or fresh data.
| Value | What you get | Use it for |
|---|---|---|
final (default) |
Only finalised days | Monthly client reports and period comparisons |
all |
Finalised days plus fresh, still-incomplete data | Early warning checks during an update or incident |
hourly_all |
Hourly rows, used with the HOUR dimension | Checking whether a specific day’s “drop” is real |
When you request fresh data, the response metadata includes first_incomplete_date. Every day from that date onwards is still filling in. Dates are based on the America/Los_Angeles time zone, so a Dhaka or Sydney “today” may already be “tomorrow” in Google’s data.
Never report incomplete days as drops. A partial day always shows fewer impressions and clicks than a complete one. This matters in practice: during the September 2026 spam update week, Search Console reportedly fell almost three days behind (getlooploop).
Rule for every report:
1. Read first_incomplete_date from the response metadata.
2. Cut the date range off at the day before it.
3. If you show fresh data at all, label it "incomplete" in the chart.
Hourly data for incident checks
Suppose a tracker shows a keyword falling out of the top 10 on one day, then returning the next. Was it a real drop, or a poisoned SERP that only the tracker saw?
The API returns hourly data for up to the last 10 days, while the UI shows only the last 24 hours. Filter on the affected query and pull it hour by hour:
{
  "startDate": "2026-10-09",
  "endDate": "2026-10-17",
  "dimensions": ["hour"],
  "type": "web",
  "dataState": "hourly_all",
  "dimensionFilterGroups": [{
    "filters": [{
      "dimension": "query",
      "operator": "equals",
      "expression": "[tracked keyword]"
    }]
  }]
}
Then read it like this:
| Tracker says | Hourly GSC shows | Conclusion |
|---|---|---|
| Dropped from [X] to outside top 10 | Impressions and position steady through the same hours | Measurement problem. Do not report a drop. |
| Dropped from [X] to outside top 10 | Impressions fall sharply and position worsens in the same window | Real visibility change. Investigate the page. |
| Dropped for one fetch, recovered next day | No visible dip | Treat as noise. Note it, do not act on it. |
Low-volume queries may have too few hourly impressions to judge. In that case, check the page as a whole rather than the single query.
No-code options for non-developers
You do not need to write code to get beyond 1,000 rows:
- Looker Studio’s Search Console connector pulls query and page data straight into dashboards.
- Google Sheets add-ons can call the API and paginate for you.
- Bulk Data Export to BigQuery suits larger stores. Plan for the BigQuery costs before you switch it on.
Features and limits of third-party add-ons change often. Before you rely on one, check what it currently supports, including whether it offers dataState and hourly data. If you want to group the exported queries by topic afterwards, see Search Console Query Groups for Content Strategy.
Adding GA4 landing-page data to prove business impact
Search Console tells you how Google showed the site. It does not tell you whether those visits became leads or sales.
Clients and managers care about the second part. GA4 landing-page data links visibility to business results. It also stops a ranking chart from becoming the whole story.
Build the organic landing page view
- In GA4, go to Reports > Engagement > Landing page.
- Click Add filter and set Session default channel group exactly matches Organic Search.
- Open the date picker, set the reporting month and switch on Compare against the previous period, or the same month last year for seasonal businesses.
- Make sure the table shows sessions, key events and, for stores, ecommerce purchases and revenue. If a metric is missing, customise the report and add it.
- Save the report so you are not rebuilding the filter every month.
GA4 renames and moves menu items from time to time. Check these labels in your own property before you write them into a client SOP.
If your GA4 property is linked to Search Console, GA4 also offers Search Console reports that show organic landing pages alongside GSC metrics. They are useful, but the join described below gives you more control.
What to report for each organic landing page
| Metric | Why it matters | Applies to |
|---|---|---|
| Sessions | Organic visits that actually loaded and tracked | All sites |
| Key events | Form submissions, calls, bookings: whatever you marked as key | Lead-generation sites |
| Ecommerce purchases | Orders where the session started on that page | WooCommerce |
| Purchase revenue | Money tied to the organic entry page | WooCommerce |
For WooCommerce, these figures depend on your GA4 ecommerce tracking sending purchase events correctly. Place a test order and confirm it appears in GA4 before you trust revenue by landing page.
Remember that the report credits the landing page of the session in which the purchase happened. A shopper who found a guide through Google and bought days later from a direct visit will not appear under that guide.
Join GSC page data to GA4 landing pages
The join explains the cause. You can show that impressions fell, so clicks fell, so leads fell. You can also show that rankings were fine and the problem started after the click.
GSC reports full URLs. GA4 reports paths. Normalise both before you match them:
GSC page:      https://www.example.com/hiking-tents/?ref=nav
GA4 landing:   /hiking-tents/
Normalised:    /hiking-tents/

Rules:
- Strip protocol and domain from GSC URLs
- Remove query strings and #fragments
- Use one trailing-slash convention throughout
- Lowercase everything
Then read each page from left to right:
| Impressions | Clicks | Organic sessions | Key events / revenue | Likely cause |
|---|---|---|---|---|
| Down | Down | Down | Down | Real visibility loss. Check rankings, updates and indexing. |
| Steady | Down | Down | Down | CTR problem: SERP features, AI Overviews or snippet changes. |
| Steady | Steady | Down | Down | Tracking or consent problem, not SEO. |
| Steady | Steady | Steady | Down | On-site problem: checkout, forms, pricing or stock. |
Split branded and non-branded queries before you draw conclusions. Brand demand can hide a non-brand loss. See Branded vs Non-Branded SEO in Search Console for that method.
“GA4 organic sessions should match Search Console clicks.”
They will not. A click is counted when someone clicks a result. A session is counted only if the page loads, the tag fires and consent allows it. Compare trends, not totals.
Pitfalls that look like SEO drops
- Consent mode gaps. Visitors who decline analytics cookies may be missing or modelled. A new cookie banner or a change to consent settings can cut organic sessions overnight while GSC clicks stay flat. Check the date of any banner change first.
- Untagged AI referrals. A reported drop in ChatGPT traffic in GA4 appears to be a tracking problem caused by links without UTM tags (Search Engine Journal). This is the same lesson as poisoned SERPs: a broken measurement is not a performance drop. Set up AI channels properly with Track AI Referral Traffic in GA4.
- Bot traffic spikes. Sudden bursts of very short, zero-engagement sessions can inflate one month and make the next look like a crash. Practitioners often raise unusual traffic patterns in ranking chatter (Search Engine Roundtable). Check engagement rate and location before you report the change.
- AI feature clicks. Reporting on clicks from AI Overviews and AI Mode links has been changing (Search Engine Roundtable). Check Google’s current documentation before you explain AI-driven clicks to a client. Our guide to Search Console generative AI performance reports covers what you can measure today.
If GSC and GA4 tell different stories and you cannot find the cause, start with a free SEO
Manual SERP spot checks that hold up in a client meeting
Sometimes a client or manager opens Google, searches their main keyword and says, “We’ve dropped.” A manual spot check is how you answer that with evidence instead of opinion.
It is a confirmation tool, not a tracking method. Used properly, it settles a dispute in minutes. Used daily, it creates more noise than the trackers it is meant to check.
“I searched it on my phone this morning and we’re not on page one. The rankings have collapsed.”
One search from one device in one place shows one personalised result at one moment. Google’s John Mueller has explained that Search Console data comes from real results shown to users, and that differences from manual checks come from personalisation, geo-targeting or visibility that only lasts a short time (Search Engine Journal). A single manual search shows what happened, but it does not show a trend.
When to do a manual check
- Do it when a tracker shows a drop on a high-value query and someone is asking whether it is real.
- Do it when Search Console is lagging and you need a quick sense check before final data arrives.
- Do it when a client reports something they saw themselves and you need to reproduce it properly.
- Don’t do it daily, across your whole keyword list, or as a replacement for Search Console.
How to run a check that someone else can repeat
- Open a signed-out private window. Use Incognito in Chrome or a Private window in Firefox or Safari. This removes the effect of your search history, but it does not remove location.
- Set the right country and location. Search results for local and service queries change from suburb to suburb. A check from Dhaka tells you very little about a Melbourne plumber’s results.
- Use Ad Preview and Diagnosis for location-specific views. In Google Ads, the Ad Preview and Diagnosis tool lets you choose a location, language and device and see the results page without registering an impression. It usually sits under Tools > Troubleshooting, but Google moves Ads menus around, so check the current path in your account.
- Check both mobile and desktop. Layouts, AI Overviews and local packs often differ between them. Most small-business traffic is mobile, so never check desktop only.
- Note whether an AI Overview appears. An AI Overview can push your organic result down the screen while your position stays the same.
- Take a dated screenshot. Make sure the screenshot shows the query, the date and time, and the location setting. File names like
2026-10-18_mobile_sydney_query.pngmake the log easy to audit later. - Compare with Search Console for the same period. Filter the Performance report to that exact query and country. Remember that average position is the topmost position of your link, averaged across all impressions (Search Console Help). It will rarely match a single manual check exactly.
Sample spot-check log
Keep a simple log like the one below. The values are illustrative only, not real client data. They show how one log can record three different outcomes.
| Query | Location | Device | Date / time | Position seen | AI Overview present | GSC position (same period) | Verdict |
|---|---|---|---|---|---|---|---|
| [service] + [city] | [City], AU | Mobile | [Day 1], 10:15 | 4 | Yes | 4.3 | Consistent: tracker drop not confirmed |
| [service] + [city] | [City], AU | Desktop | [Day 1], 10:20 | 3 | No | 4.3 | Consistent |
| [product category] | UK (national) | Mobile | [Day 1], 11:00 | Not in top 10 | Yes | [X] (falling for 5 days) | Agrees with GSC: investigate |
| [product category] | UK (national) | Mobile | [Day 3], 15:40 | Not in top 10 | Yes | [X] | Drop confirmed on two days |
Rules for spot checks
- Check 3–5 queries, not one. Pick the queries that matter most to revenue or leads. If you need help separating them, see branded vs non-branded SEO in Search Console.
- Repeat on two different days. A result that appears once and then disappears is not a ranking change.
- Never treat one manual check as a ranking. In your report, call it an “observation” and set it next to the Search Console figure.
- Record what you did not control. Note the network, the VPN and whether you were signed in. Honest notes make your report more credible.
Rules for when to trust or ignore a tracker swing
Since mid-September 2026, rank tracker data has needed a filter before it goes into a report. Nozzle reports that some tracker requests to Google returned normal-looking results pages with swapped-out results. In its data, 8.0% of 17.8 million judged SERPs were affected from 13 September, compared with 0.17% before (Nozzle).
This is vendor-reported. Google has not commented. Still, the pattern is consistent enough to build rules around.
Why a three-day window
Nozzle found that 77.9% of poisoned results recovered within three days, and that 80% of poisoned spells lasted a single fetch (Relevant Audience, DEV Community).
So most fake drops clear up quickly. A drop that lasts more than three days, and that Search Console also shows, deserves attention.
There is also a practical reason to wait. Search Console fell almost three days behind during the spam update week (getlooploop). Reacting on day one often means comparing a tracker against data that has not arrived yet.
The decision table
| Tracker | Search Console | Duration | GA4 organic landing sessions | Verdict and action |
|---|---|---|---|---|
| Drop | Impressions and position stable | Bounced back within 3 days | Stable | Likely bad tracker data. Ignore it, and log a note in the report. |
| Drop | Agrees (position worse, impressions down) | 3+ days | Stable or not yet clear | Investigate. Check pages, indexing, competitors and confirmed updates. |
| Drop | Agrees | 3+ days | Down on the affected landing pages | Real business issue. Escalate, prioritise fixes and tell the client. |
| Stable | Stable | Any | Down | Probably not a ranking problem. Check tracking, conversion tagging and seasonality first. |
| Drop | No data yet (lagging) | Under 3 days | Stable | Wait. Re-check once final data arrives. |
The fourth row matters. Measurement breaks happen in GA4 too. Search Engine Journal reported that an apparent ChatGPT traffic drop looked like a tracking problem caused by links without UTM tags (Search Engine Journal). For the setup side, see how to track AI referral traffic in GA4.
Red flags of a poisoned fetch
Nothing on a poisoned page announces itself. These signs should still make you suspicious:
- Your site and your usual competitors vanish together. A real update rarely removes everyone you normally compete with on the same day.
- UGC-heavy results appear where they don’t usually rank, such as forums and discussion threads. Search Engine Journal noted more UGC on poisoned pages (Search Engine Journal).
- The AI Overview is missing on a query that normally shows one. Nozzle’s data showed AI Overviews on 34.9% of poisoned pages, compared with 54.2% normally.
- The results look truncated. Morningscore reported truncated results as a related problem (Elsop).
- The drop is large and sudden. On poisoned pages, tracked sites missed the top 10 58.6% of the time, compared with 2.7% normally.
Not every daily swing is poisoning, though. Practitioners also point to blocked requests, the loss of num=100, the need to render JavaScript and trackers sampling results (Search Engine Roundtable). Some of what you see is ordinary measurement noise.
Example drop-checker output
A simple script can join tracker history with Search Console rows and return a verdict for each query. The output below is illustrative, with placeholder queries:
DROP CHECK  |  window: last 7 days  |  GSC dataState: final

query: [service] + [city]
  tracker:  pos 3 -> not in top 10 (1 fetch) -> pos 3
  gsc:      avg pos 3.6 -> 3.8 | impressions -2%
  flags:    competitors also missing, AI Overview absent
  verdict:  LIKELY BAD TRACKER DATA - ignore, note in report

query: [product category]
  tracker:  pos 5 -> 14 (5 consecutive fetches)
  gsc:      avg pos 5.2 -> 11.9 | impressions -38%
  ga4:      organic landing sessions on /category/ -[X]%
  verdict:  REAL ISSUE - investigate page and escalate

query: [brand] + reviews
  tracker:  pos 2 -> 9 (2 fetches)
  gsc:      data incomplete for last 2 days
  verdict:  WAIT - re-run when GSC final data lands
Escalation rule: check confirmed updates first
Before you tell anyone “it’s an algorithm update”, open the Google Search Status Dashboard and confirm that an update was actually running on those dates.
The overlap this autumn is awkward. The September 2026 spam update ran from 24 September to 8 October 2026, and volatility waves were reported on 25–27 September, 30 September and 4–6 October (Search Engine Roundtable). Poisoned SERPs peaked at 27.0% on 29 September, inside that same window.
That means tracker charts of the spam update rollout may be partly wrong. Judge your exposure to the update from Search Console, not from tracker volatility.
If Search Console and GA4 both confirm a sustained drop that lines up with a confirmed update, move to a structured recovery process like this ranking recovery checklist.
If you’re not sure whether a drop is real, a free SEO check is a quick way to get a second opinion.
Worked example: yellystoneoutdoors.com
This walkthrough applies the full method to a real site, yellystoneoutdoors.com. It shows the order of checks, the screens used and how the verdict was reached.
No performance figures for this site have been supplied for publication. Every number below is a labelled placeholder such as [X]. Replace them with your own data when you run the same process on your site.
Step 1: The tracker alert
The process starts with a rank tracker email or dashboard flag. A typical alert looks like this:
Alert: [Keyword A] dropped from position [X] to [Y]
Date flagged: [date]
Keywords affected: [N] of [total tracked]
Tracker location/device: [country], [desktop/mobile]
Before opening Search Console, record three facts:
- Is this a single fetch or several days in a row? Nozzle reports that 80% of the poisoned spells it found lasted only one fetch (DEV Community summary).
- Does the date fall inside a known event window? The September 2026 spam update ran from 24 September to 8 October 2026 (Search Engine Roundtable). Most of the poisoned SERPs Nozzle reported fall in those same weeks.
- Did many unrelated keywords move together? A drop that is broad, sudden and shows no pattern is more often a measurement problem than a ranking problem.
Step 2: Search Console compare by page and query cluster
Open Performance → Search results for the yellystoneoutdoors.com property. Then set it up as follows:
- Click Date → Compare. Choose the [N] days after the alert and the same number of days before it. Match the days of the week so a weekend does not skew the comparison.
- Exclude the most recent days if they are still incomplete. Search Console fell almost three days behind during the spam-update week (getlooploop).
- Add a Query → Custom (regex) filter for the cluster that contains the alerted keyword. Exclude branded terms; see branded vs non-branded SEO in Search Console.
- Switch to the Pages tab and find the URL that the tracker says dropped.
Record the results in a simple table:
| Check | Before | After | Change |
|---|---|---|---|
| Cluster clicks ([cluster name]) | [X] | [X] | [X%] |
| Cluster impressions | [X] | [X] | [X%] |
| Alerted page: average position (table row) | [X] | [X] | [±X] |
| Alerted query: average position | [X] | [X] | [±X] |
Read the position per row, not from the chart. In the chart, average position is the topmost result from the whole site. In the table, it is calculated for each query or page (Search Console Help).
Step 3: GA4 organic landing pages
Next, check whether visitors and business results changed. In GA4:
- Go to Reports → Engagement → Landing page.
- Add a filter: Session default channel group exactly matches Organic Search.
- Use the same two date ranges as in Search Console.
- Note sessions, key events and revenue (if ecommerce tracking is set up) for the alerted page and its cluster.
| Landing page | Organic sessions (before → after) | Key events (before → after) |
|---|---|---|
| [alerted page URL] | [X] → [X] | [X] → [X] |
| [other cluster page] | [X] → [X] | [X] → [X] |
Step 4: Manual spot check
Run one controlled check using the method from the previous section. Use a signed-out browser, with the location and device that match the tracker settings.
Take a screenshot, write down the time, and note where the page appears: [position or “not in top 10”].
A single check confirms or questions the tracker. It does not replace Search Console.
Step 5: The verdict
Use this decision table to turn the evidence into one of three verdicts:
| Evidence pattern | Verdict |
|---|---|
| Tracker drop, but GSC clicks, impressions and per-row position are stable, and GA4 is flat | Ignore: treat it as a tracker anomaly |
| GSC shows a small position change, clicks are within normal range, and the date overlaps an update | Monitor: recheck in 7 days |
| GSC clicks and impressions are down across the cluster, and GA4 key events fall with them | Act: investigate the page, intent and competitors |
Record the decision for yellystoneoutdoors.com as: [Ignore / Monitor / Act]. Base it on the matching row above, and write down which evidence decided it.
The client-facing explanation
Turn the findings into three or four plain sentences. For example:
Our rank tracker reported a drop for [keyword] on [date].
Google's own Search Console data shows clicks and impressions for that topic were [stable / down X%] over the same period.
Visits and enquiries from Google in GA4 were [unchanged / down X%].
Our decision is to [ignore / monitor until (date) / act on (specific fix)].
Report templates for clients and managers
Good templates stop people from overreacting. Each one below puts first-party data first and keeps tracker data in a supporting role.
Monthly client report
Report by query cluster rather than by single keyword. If you have not set up clusters yet, see Search Console query groups for content strategy.
| Metric | Source | This month | Last month | Same month last year |
|---|---|---|---|---|
| Organic clicks (non-brand), per cluster | GSC | [X] | [X] | [X] |
| Impressions, per cluster | GSC | [X] | [X] | [X] |
| CTR, per cluster | GSC | [X%] | [X%] | [X%] |
| Average position, per cluster (table rows) | GSC | [X] | [X] | [X] |
| Organic sessions | GA4 | [X] | [X] | [X] |
| Key events / revenue | GA4 | [X] | [X] | [X] |
| Top 5 gaining pages | GSC + GA4 | [URL, clicks change, likely reason] | ||
| Top 5 losing pages | GSC + GA4 | [URL, clicks change, likely reason] | ||
| Actions taken | Work log | [list] | ||
| Next steps | Plan | [list, with owner and date] |
Add a short note when AI features affect click data. Google has said it will not show click data for some updated AI Mode and AI Overview link formats (Search Engine Roundtable). Check Google’s current wording before you quote it to a client.
Weekly manager update
Keep the weekly update to five lines:
1. What changed: [cluster/page] clicks [up/down X%] vs same weekdays last week
2. Is it real: [Yes / No / Unclear]
3. Evidence source: [GSC compare, GA4 landing pages, spot check screenshot]
4. Action: [none / monitor / specific fix]
5. Next check: [date]
Tracker incident note
Send this note when a tracker shows a drop that first-party data does not support:
Subject: Rank tracker alert on [date] – no action needed yet

Our ranking tool reported that [page/keyword] dropped on [date].
Several rank tracking companies have recently reported that Google
sometimes shows their tools different results from the ones real
searchers see. Google has not confirmed this.

To check, we looked at Google's own data about real searches for
your site. Over the same days, visits from Google were [stable / down X%]
and enquiries/sales were [stable / down X%].

What we are doing: [monitoring until (date) / no action / fixing X].
We will update you on [date].
Resetting expectations and KPIs
“The goal is to rank #1 for [keyword].”
A single-keyword position is now the least reliable number in SEO reporting. It also says nothing about revenue.
Move contracts and SLAs towards measures that come from first-party data. Suggested wording:
- “Success is measured by non-brand Google Search clicks and impressions for agreed query clusters, as reported in Google Search Console, together with organic key events in GA4.”
- “Third-party rank tracking is provided for diagnostic purposes only and is not a contractual performance measure.”
- “Performance is reviewed on rolling 28-day and year-on-year comparisons. Single-day changes are not used for evaluation.”
If you need help redesigning KPIs for an existing contract, you can book a free consultation.
Common mistakes checklist
- Reporting single-day drops. Use 7-day or 28-day comparisons with matched weekdays.
- Mixing brand and non-brand queries. Brand demand hides real SEO gains and losses.
- Using site-wide average position. The chart figure blends every query. Report position per cluster or per row instead.
- Ignoring incomplete days. Recent days may be partial. The API’s
first_incomplete_datemetadata flags them (Google for Developers). - Treating trackers as ground truth. They sample results and can be served altered pages. Confirm any change in Search Console first.
- Confusing measurement breaks with performance drops. The same applies to AI referrals in GA4; see tracking AI referral traffic in GA4.
Frequently Asked Questions
Why does my rank tracker show a drop that Search Console doesn’t?
Your tracker records one scraped results page from one location, device and moment. Search Console averages the positions Google actually showed to real users. Since mid-September 2026, vendors have also reported trackers receiving altered results pages, so a tracker-only drop is often a measurement problem rather than a ranking loss.
What is a poisoned SERP?
It is a results page that loads normally and looks complete, but the results have been swapped out. Because nothing looks broken, the tracker stores it as real data and shows a drop with no warning. You can usually only spot it from the keyword’s history, such as a one-day fall that quickly returns to the usual position.
Is Google deliberately blocking rank trackers?
Google has not commented on poisoned SERPs. Nozzle’s theory is that Google is targeting AI scraping and grounding, and rank trackers are caught in the same net. That is plausible but unconfirmed, so do not present it to clients as fact.
Why is my Search Console average position different from what I see when I search?
Your own results are affected by your search history, signed-in state and location. Search Console averages the topmost position of your link across all real impressions, including searches from other places and devices, and short spells of visibility. An average such as 4.0 is normal even if no single user saw position 4.
How long should I wait before treating a ranking drop as real?
Do not act on a drop that recovers within three days, because most affected keywords in vendor data recovered in that window. Check that Search Console shows lower impressions and position for the same query over a 7 to 28 day comparison. Use only complete days, as Search Console data can lag by a few days.
Did the September 2026 spam update hit my site, or is it tracker error?
It could be either, or both, because the worst poisoning fell inside the spam update rollout from 24 September to 8 October. Ignore tracker screenshots for this period and compare Search Console clicks and impressions before and after the rollout. If the drop is clear there, work through a recovery checklist.
Are rank trackers still worth paying for?
Yes, as a diagnostic tool rather than proof of gains or losses. They are useful for seeing which competitor moved, or whether a page lost a SERP feature. Base your reporting and decisions on Search Console and GA4 data.
Final Thoughts
Treat every tracker drop as a question, not an answer. Check whether Search Console shows the same fall in impressions and position, whether the drop lasted more than three days, and whether other keywords on the same page moved too.
Change your report order this month. Put clicks, leads and revenue first, Search Console visibility second, and tracker positions last as a diagnostic. When you mention poisoned SERPs, describe them as vendor-reported.
Finally, re-read Google’s Search Console help page on average position from time to time, and keep an eye on vendor updates. This story is still developing, and the rules for reading tracker data may change again.
Want help applying this to your site? Run the free SEO check or book a free consultation with MD Harunur Rashid. Free SEO check · Book a free consultation